
Id stringlengths 1 6 | PostTypeId stringclasses 7
values | AcceptedAnswerId stringlengths 1 6 ⌀ | ParentId stringlengths 1 6 ⌀ | Score stringlengths 1 4 | ViewCount stringlengths 1 7 ⌀ | Body stringlengths 0 38.7k | Title stringlengths 15 150 ⌀ | ContentLicense stringclasses 3
values | FavoriteCount stringclasses 3
values | CreationDate stringlengths 23 23 | LastActivityDate stringlengths 23 23 | LastEditDate stringlengths 23 23 ⌀ | LastEditorUserId stringlengths 1 6 ⌀ | OwnerUserId stringlengths 1 6 ⌀ | Tags sequence |
|---|---|---|---|---|---|---|---|---|---|---|---|---|---|---|---|
1 | 1 | 15 | null | 49 | 5466 | How should I elicit prior distributions from experts when fitting a Bayesian model?
| Eliciting priors from experts | CC BY-SA 2.5 | null | 2010-07-19T19:12:12.510 | 2020-11-05T09:44:51.710 | null | null | 8 | [
"bayesian",
"prior",
"elicitation"
] |
2 | 1 | 59 | null | 34 | 33671 | In many different statistical methods there is an "assumption of normality". What is "normality" and how do I know if there is normality?
| What is normality? | CC BY-SA 2.5 | null | 2010-07-19T19:12:57.157 | 2022-11-23T13:03:42.033 | 2010-08-07T17:56:44.800 | null | 24 | [
"distributions",
"normality-assumption"
] |
3 | 1 | 5 | null | 71 | 6650 | What are some valuable Statistical Analysis open source projects available right now?
Edit: as pointed out by Sharpie, valuable could mean helping you get things done faster or more cheaply.
| What are some valuable Statistical Analysis open source projects? | CC BY-SA 2.5 | null | 2010-07-19T19:13:28.577 | 2022-11-27T23:33:13.540 | 2011-02-12T05:50:03.667 | 183 | 18 | [
"software",
"open-source"
] |
4 | 1 | 135 | null | 23 | 45871 | I have two groups of data. Each with a different distribution of multiple variables. I'm trying to determine if these two groups' distributions are different in a statistically significant way. I have the data in both raw form and binned up in easier to deal with discrete categories with frequency counts in each.
... | Assessing the significance of differences in distributions | CC BY-SA 2.5 | null | 2010-07-19T19:13:31.617 | 2010-09-08T03:00:19.690 | null | null | 23 | [
"distributions",
"statistical-significance"
] |
5 | 2 | null | 3 | 90 | null | The R-project
[http://www.r-project.org/](http://www.r-project.org/)
R is valuable and significant because it was the first widely-accepted Open-Source alternative to big-box packages. It's mature, well supported, and a standard within many scientific communities.
- Some reasons why it is useful and valuable
- Ther... | null | CC BY-SA 2.5 | null | 2010-07-19T19:14:43.050 | 2010-07-19T19:21:15.063 | 2010-07-19T19:21:15.063 | 23 | 23 | null |
6 | 1 | null | null | 486 | 173164 | Last year, I read a blog post from [Brendan O'Connor](http://anyall.org/) entitled ["Statistics vs. Machine Learning, fight!"](http://anyall.org/blog/2008/12/statistics-vs-machine-learning-fight/) that discussed some of the differences between the two fields. [Andrew Gelman responded favorably to this](http://andrewge... | The Two Cultures: statistics vs. machine learning? | CC BY-SA 3.0 | null | 2010-07-19T19:14:44.080 | 2021-01-19T17:59:15.653 | 2017-04-08T17:58:18.247 | 11887 | 5 | [
"machine-learning",
"pac-learning"
] |
7 | 1 | 18 | null | 103 | 42538 | I've been working on a new method for analyzing and parsing datasets to identify and isolate subgroups of a population without foreknowledge of any subgroup's characteristics. While the method works well enough with artificial data samples (i.e. datasets created specifically for the purpose of identifying and segregat... | Locating freely available data samples | CC BY-SA 2.5 | null | 2010-07-19T19:15:59.303 | 2022-11-30T05:37:29.877 | 2013-09-26T21:50:36.963 | 253 | 38 | [
"dataset",
"sample",
"population",
"teaching"
] |
9 | 2 | null | 3 | 15 | null | [Incanter](http://incanter.org/) is a Clojure-based, R-like platform (environment + libraries) for statistical computing and graphics.
| null | CC BY-SA 2.5 | null | 2010-07-19T19:16:27.553 | 2010-07-19T19:16:27.553 | null | null | 50 | null |
10 | 1 | 1887 | null | 63 | 119038 | Many studies in the social sciences use Likert scales. When is it appropriate to use Likert data as ordinal and when is it appropriate to use it as interval data?
| Under what conditions should Likert scales be used as ordinal or interval data? | CC BY-SA 2.5 | null | 2010-07-19T19:17:47.537 | 2021-02-04T18:28:52.953 | 2017-01-26T11:52:53.043 | 28666 | 24 | [
"ordinal-data",
"likert",
"scales",
"measurement"
] |
11 | 1 | 1201 | null | 5 | 355 | Is there a good, modern treatment covering the various methods of multivariate interpolation, including which methodologies are typically best for particular types of problems? I'm interested in a solid statistical treatment including error estimates under various model assumptions.
An example:
[Shepard's method](http:... | Multivariate Interpolation Approaches | CC BY-SA 2.5 | null | 2010-07-19T19:18:30.810 | 2010-08-03T21:50:09.007 | 2010-07-28T07:58:52.320 | 34 | 34 | [
"multivariable",
"interpolation"
] |
12 | 2 | null | 7 | 24 | null | See my response to ["Datasets for Running Statistical Analysis on"](https://stackoverflow.com/questions/2252144/datasets-for-running-statistical-analysis-on/2252450#2252450) in reference to datasets in R.
| null | CC BY-SA 2.5 | null | 2010-07-19T19:18:41.370 | 2010-07-19T19:18:41.370 | 2017-05-23T12:39:26.143 | -1 | 5 | null |
13 | 2 | null | 6 | 27 | null | Machine Learning seems to have its basis in the pragmatic - a Practical observation or simulation of reality. Even within statistics, mindless "checking of models and assumptions" can lead to discarding methods that are useful.
For example, years ago, the very first commercially available (and working) Bankruptcy mode... | null | CC BY-SA 2.5 | null | 2010-07-19T19:18:56.800 | 2010-07-19T19:18:56.800 | null | null | 23 | null |
14 | 2 | null | 3 | 6 | null | I second that Jay. Why is R valuable? Here's a short list of reasons. [http://www.inside-r.org/why-use-r](http://www.inside-r.org/why-use-r). Also check out [ggplot2](http://had.co.nz/ggplot2/) - a very nice graphics package for R. Some nice tutorials [here](http://gettinggeneticsdone.blogspot.com/search/label/ggplot2)... | null | CC BY-SA 2.5 | null | 2010-07-19T19:19:03.990 | 2010-07-19T19:19:03.990 | null | null | 36 | null |
15 | 2 | null | 1 | 23 | null | John Cook gives some interesting recommendations. Basically, get percentiles/quantiles (not means or obscure scale parameters!) from the experts, and fit them with the appropriate distribution.
[http://www.johndcook.com/blog/2010/01/31/parameters-from-percentiles/](http://www.johndcook.com/blog/2010/01/31/parameters-fr... | null | CC BY-SA 2.5 | null | 2010-07-19T19:19:46.160 | 2010-07-19T19:19:46.160 | null | null | 6 | null |
16 | 2 | null | 3 | 17 | null | Two projects spring to mind:
- Bugs - taking (some of) the pain out of Bayesian statistics. It allows the user to focus more on the model and a bit less on MCMC.
- Bioconductor - perhaps the most popular statistical tool in Bioinformatics. I know it's a R repository, but there are a large number of people who want to... | null | CC BY-SA 2.5 | null | 2010-07-19T19:22:31.190 | 2010-07-19T20:43:02.683 | 2010-07-19T20:43:02.683 | 8 | 8 | null |
17 | 1 | 29 | null | 12 | 1903 | I have four competing models which I use to predict a binary outcome variable (say, employment status after graduating, 1 = employed, 0 = not-employed) for n subjects. A natural metric of model performance is hit rate which is the percentage of correct predictions for each one of the models.
It seems to me that I cann... | How can I adapt ANOVA for binary data? | CC BY-SA 2.5 | null | 2010-07-19T19:24:12.187 | 2012-01-22T23:34:51.837 | 2012-01-22T23:34:51.837 | 7972 | null | [
"anova",
"chi-squared-test",
"generalized-linear-model"
] |
18 | 2 | null | 7 | 43 | null | Also see the UCI machine learning Data Repository.
[http://archive.ics.uci.edu/ml/](http://archive.ics.uci.edu/ml/)
| null | CC BY-SA 2.5 | null | 2010-07-19T19:24:18.580 | 2010-07-19T19:24:18.580 | null | null | 36 | null |
19 | 2 | null | 7 | 16 | null | [Gapminder](http://www.gapminder.org/data/) has a number (430 at the last look) of datasets, which may or may not be of use to you.
| null | CC BY-SA 2.5 | null | 2010-07-19T19:24:21.327 | 2010-07-19T19:24:21.327 | null | null | 55 | null |
20 | 2 | null | 2 | 3 | null | The assumption of normality assumes your data is normally distributed (the bell curve, or gaussian distribution). You can check this by plotting the data or checking the measures for kurtosis (how sharp the peak is) and skewdness (?) (if more than half the data is on one side of the peak).
| null | CC BY-SA 2.5 | null | 2010-07-19T19:24:35.803 | 2010-07-19T19:24:35.803 | null | null | 37 | null |
21 | 1 | null | null | 6 | 304 | What are some of the ways to forecast demographic census with some validation and calibration techniques?
Some of the concerns:
- Census blocks vary in sizes as rural
areas are a lot larger than condensed
urban areas. Is there a need to account for the area size difference?
- if let's say I have census data
dating ba... | Forecasting demographic census | CC BY-SA 2.5 | null | 2010-07-19T19:24:36.303 | 2019-08-04T09:23:05.420 | 2019-08-04T09:23:05.420 | 11887 | 59 | [
"forecasting",
"population",
"demography",
"census"
] |
22 | 1 | null | null | 431 | 276770 | How would you describe in plain English the characteristics that distinguish Bayesian from Frequentist reasoning?
| Bayesian and frequentist reasoning in plain English | CC BY-SA 3.0 | null | 2010-07-19T19:25:39.467 | 2022-10-28T14:15:46.433 | 2011-10-04T07:05:14.067 | 930 | 66 | [
"bayesian",
"frequentist"
] |
23 | 1 | 91 | null | 27 | 105467 | How can I find the PDF (probability density function) of a distribution given the CDF (cumulative distribution function)?
| Finding the PDF given the CDF | CC BY-SA 2.5 | null | 2010-07-19T19:26:04.363 | 2019-11-25T03:17:45.387 | null | null | 69 | [
"distributions",
"density-function",
"cumulative-distribution-function"
] |
24 | 2 | null | 3 | 22 | null | For doing a variety of MCMC tasks in Python, there's [PyMC](https://www.pymc.io/welcome.html), which I've gotten quite a bit of use out of. I haven't run across anything that I can do in BUGS that I can't do in PyMC, and the way you specify models and bring in data seems to be a lot more intuitive to me.
| null | CC BY-SA 4.0 | null | 2010-07-19T19:26:13.693 | 2022-11-27T23:15:56.147 | 2022-11-27T23:15:56.147 | 362671 | 61 | null |
25 | 1 | 32 | null | 10 | 4041 | What modern tools (Windows-based) do you suggest for modeling financial time series?
| Tools for modeling financial time series | CC BY-SA 2.5 | null | 2010-07-19T19:27:13.503 | 2022-12-03T14:50:44.067 | 2010-07-26T23:38:29.430 | 69 | 69 | [
"modeling",
"time-series",
"finance",
"software"
] |
26 | 1 | 61 | null | 38 | 25091 | What is a standard deviation, how is it calculated and what is its use in statistics?
| What is a standard deviation? | CC BY-SA 3.0 | null | 2010-07-19T19:27:43.860 | 2017-11-12T21:26:05.097 | 2017-11-12T21:26:05.097 | 11887 | 75 | [
"standard-deviation"
] |
28 | 2 | null | 3 | 7 | null | [GSL](http://www.gnu.org/software/gsl/) for those of you who wish to program in C / C++ is a valuable resource as it provides several routines for random generators, linear algebra etc. While GSL is primarily available for Linux there are also ports for Windows (See: [this](https://web.archive.org/web/20110817071546/ht... | null | CC BY-SA 4.0 | null | 2010-07-19T19:28:12.830 | 2022-11-27T23:14:52.687 | 2022-11-27T23:14:52.687 | 362671 | null | null |
29 | 2 | null | 17 | 8 | null | Contingency table (chi-square). Also Logistic Regression is your friend - use dummy variables.
| null | CC BY-SA 2.5 | null | 2010-07-19T19:28:15.640 | 2010-07-19T19:28:15.640 | null | null | 36 | null |
30 | 1 | 55 | null | 16 | 1992 | Which methods are used for testing random variate generation algorithms?
| Testing random variate generation algorithms | CC BY-SA 2.5 | null | 2010-07-19T19:28:34.220 | 2022-12-05T08:26:28.510 | 2010-08-25T14:12:54.547 | 919 | 69 | [
"algorithms",
"hypothesis-testing",
"random-variable",
"random-generation"
] |
31 | 1 | null | null | 289 | 545327 | After taking a statistics course and then trying to help fellow students, I noticed one subject that inspires much head-desk banging is interpreting the results of statistical hypothesis tests. It seems that students easily learn how to perform the calculations required by a given test but get hung up on interpreting ... | What is the meaning of p values and t values in statistical tests? | CC BY-SA 3.0 | null | 2010-07-19T19:28:44.903 | 2023-01-27T12:12:00.777 | 2019-09-27T13:22:45.057 | 919 | 13 | [
"hypothesis-testing",
"p-value",
"interpretation",
"intuition",
"faq"
] |
32 | 2 | null | 25 | 16 | null | I recommend R (see [the time series view on CRAN](http://cran.r-project.org/web/views/TimeSeries.html)).
Some useful references:
- Econometrics in R, by Grant Farnsworth
- Multivariate time series modelling in R
| null | CC BY-SA 2.5 | null | 2010-07-19T19:29:06.527 | 2010-07-19T19:29:06.527 | 2017-05-23T12:39:26.167 | -1 | 5 | null |
33 | 1 | 49 | null | 5 | 2578 | What R packages should I install for seasonality analysis?
| R packages for seasonality analysis | CC BY-SA 2.5 | null | 2010-07-19T19:30:03.717 | 2022-11-24T14:17:48.967 | 2010-09-16T06:56:44.040 | null | 69 | [
"r",
"seasonality"
] |
35 | 1 | 72 | null | 18 | 5678 | I have a data set that I'd expect to follow a Poisson distribution, but it is overdispersed by about 3-fold. At the present, I'm modelling this overdispersion using something like the following code in R.
```
## assuming a median value of 1500
med = 1500
rawdist = rpois(1000000,med)
oDdist = rawDist + ((rawDist-med)*3)... | Modelling a Poisson distribution with overdispersion | CC BY-SA 2.5 | null | 2010-07-19T19:30:30.390 | 2010-07-25T01:44:14.513 | 2010-07-25T01:44:14.513 | 54 | 54 | [
"distributions",
"modeling",
"poisson-distribution",
"overdispersion"
] |
36 | 1 | null | null | 83 | 389933 | There is an old saying: "Correlation does not mean causation". When I teach, I tend to use the following standard examples to illustrate this point:
- number of storks and birth rate in Denmark;
- number of priests in America and alcoholism;
- in the start of the 20th century it was noted that there was a strong cor... | Examples for teaching: Correlation does not mean causation | CC BY-SA 3.0 | null | 2010-07-19T19:31:47.363 | 2019-08-23T10:09:53.320 | 2014-05-23T06:31:12.967 | 43889 | 8 | [
"correlation",
"teaching"
] |
38 | 2 | null | 35 | 4 | null | If your mean value for the Poisson is 1500, then you're very close to a normal distribution; you might try using that as an approximation and then modelling the mean and variance separately.
| null | CC BY-SA 2.5 | null | 2010-07-19T19:32:28.063 | 2010-07-19T19:32:28.063 | null | null | 61 | null |
39 | 1 | 721 | null | 7 | 246 | I'm looking for worked out solutions using Bayesian and/or logit analysis similar to a workbook or an annal.
The worked out problems could be of any field; however, I'm interested in urban planning / transportation related fields.
| Sample problems on logit modeling and Bayesian methods | CC BY-SA 2.5 | null | 2010-07-19T19:32:29.513 | 2010-07-27T05:40:44.950 | 2010-07-27T04:57:47.780 | 190 | 59 | [
"modeling",
"bayesian",
"logit",
"transportation"
] |
40 | 1 | 111 | null | 14 | 1003 | What algorithms are used in modern and good-quality random number generators?
| Pseudo-random number generation algorithms | CC BY-SA 2.5 | null | 2010-07-19T19:32:47.750 | 2014-01-28T07:46:08.953 | 2010-08-25T14:13:48.740 | 919 | 69 | [
"algorithms",
"random-variable",
"random-generation"
] |
41 | 2 | null | 26 | 12 | null | A quote from [Wikipedia](http://en.wikipedia.org/wiki/Standard_deviation).
>
It shows how much variation there is from the "average" (mean, or expected/budgeted value). A low standard deviation indicates that the data points tend to be very close to the mean, whereas high standard deviation indicates that the data is ... | null | CC BY-SA 3.0 | null | 2010-07-19T19:33:13.037 | 2015-06-17T08:59:36.287 | 2015-06-17T08:59:36.287 | -1 | 83 | null |
42 | 2 | null | 3 | 15 | null | [Weka](http://www.cs.waikato.ac.nz/ml/weka) for data mining - contains many classification and clustering algorithms in Java.
| null | CC BY-SA 2.5 | null | 2010-07-19T19:33:19.073 | 2010-07-19T19:33:19.073 | null | null | 80 | null |
43 | 2 | null | 25 | 7 | null | R is great, but I wouldn't really call it "windows based" :) That's like saying the cmd prompt is windows based. I guess it is technically in a window...
RapidMiner is far easier to use [1]. It's a free, open-source, multi-platform, GUI. Here's a video on time series forecasting:
[Financial Time Series Modelling - Part... | null | CC BY-SA 4.0 | null | 2010-07-19T19:33:37.497 | 2022-12-03T14:50:44.067 | 2022-12-03T14:50:44.067 | 362671 | 74 | null |
44 | 1 | 89 | null | 9 | 778 | How would you explain data visualization and why it is important to a layman?
| Explain data visualization | CC BY-SA 2.5 | null | 2010-07-19T19:34:42.643 | 2013-07-27T00:28:49.377 | 2013-07-27T00:28:49.377 | 12786 | 68 | [
"data-visualization",
"intuition"
] |
45 | 2 | null | 40 | 6 | null | The [Mersenne Twister](http://en.wikipedia.org/wiki/Mersenne_twister) is one I've come across and used before now.
| null | CC BY-SA 2.5 | null | 2010-07-19T19:34:44.033 | 2010-07-19T19:34:44.033 | null | null | 55 | null |
46 | 2 | null | 26 | 1 | null | A standard deviation is the square root of the second central moment of a distribution. A central moment is the expected difference from the expected value of the distribution. A first central moment would usually be 0, so we define a second central moment as the expected value of the squared distance of a random varia... | null | CC BY-SA 2.5 | null | 2010-07-19T19:35:04.827 | 2010-07-20T02:13:12.733 | 2010-07-20T02:13:12.733 | 62 | 62 | null |
47 | 1 | 268 | null | 9 | 1102 | I have a dataset of 130k internet users characterized by 4 variables describing users' number of sessions, locations visited, avg data download and session time aggregated from four months of activity.
Dataset is very heavy-tailed. For example third of users logged only once during four months, whereas six users had mo... | Clustering of large, heavy-tailed dataset | CC BY-SA 4.0 | null | 2010-07-19T19:36:12.140 | 2020-05-13T03:35:50.177 | 2020-05-13T03:35:50.177 | 11887 | 22 | [
"clustering",
"large-data",
"kurtosis"
] |
49 | 2 | null | 33 | 7 | null | You don't need to install any packages because this is possible with base-R functions. Have a look at [the arima function](http://www.stat.ucl.ac.be/ISdidactique/Rhelp/library/ts/html/arima.html).
This is a basic function of [Box-Jenkins analysis](http://en.wikipedia.org/wiki/Box%E2%80%93Jenkins), so you should cons... | null | CC BY-SA 2.5 | null | 2010-07-19T19:36:52.403 | 2010-07-19T19:36:52.403 | null | null | 5 | null |
50 | 1 | 85 | null | 103 | 24363 | What do they mean when they say "random variable"?
| What is meant by a "random variable"? | CC BY-SA 2.5 | null | 2010-07-19T19:37:31.873 | 2023-01-02T16:45:45.633 | 2017-04-15T16:49:34.860 | 11887 | 62 | [
"mathematical-statistics",
"random-variable",
"intuition",
"definition"
] |
51 | 1 | 64 | null | 5 | 232 | Are there any objective methods of assessment or standardized tests available to measure the effectiveness of a software that does pattern recognition?
| Measuring the effectiveness of a pattern recognition software | CC BY-SA 2.5 | null | 2010-07-19T19:37:55.630 | 2010-07-19T20:12:16.453 | null | null | 68 | [
"pattern-recognition"
] |
53 | 1 | 78 | null | 207 | 193152 | What are the main differences between performing principal component analysis (PCA) on the correlation matrix and on the covariance matrix? Do they give the same results?
| PCA on correlation or covariance? | CC BY-SA 3.0 | null | 2010-07-19T19:39:08.483 | 2022-04-09T04:48:09.847 | 2018-07-16T19:41:56.540 | 3277 | 17 | [
"correlation",
"pca",
"covariance",
"factor-analysis"
] |
54 | 1 | 65 | null | 18 | 1072 | As I understand UK Schools teach that the Standard Deviation is found using:
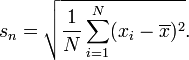
whereas US Schools teach:
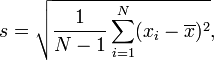
(at a basic level anyway).
This has c... | Why do US and UK Schools Teach Different methods of Calculating the Standard Deviation? | CC BY-SA 2.5 | null | 2010-07-19T19:41:19.367 | 2020-01-13T00:55:13.780 | 2017-03-09T17:30:35.957 | -1 | 55 | [
"standard-deviation",
"error",
"teaching",
"unbiased-estimator"
] |
55 | 2 | null | 30 | 12 | null | The [Diehard Test Suite](http://en.wikipedia.org/wiki/Diehard_tests) is something close to a Golden Standard for testing random number generators. It includes a number of tests where a good random number generator should produce result distributed according to some know distribution against which the outcome using the ... | null | CC BY-SA 3.0 | null | 2010-07-19T19:41:39.880 | 2011-05-12T18:38:27.547 | 2011-05-12T18:38:27.547 | 56 | 56 | null |
56 | 2 | null | 22 | 261 | null | Here is how I would explain the basic difference to my grandma:
I have misplaced my phone somewhere in the home. I can use the phone locator on the base of the instrument to locate the phone and when I press the phone locator the phone starts beeping.
Problem: Which area of my home should I search?
## Frequentist Reas... | null | CC BY-SA 3.0 | null | 2010-07-19T19:42:28.040 | 2016-01-16T19:14:26.703 | 2016-01-16T19:14:26.703 | 100906 | null | null |
57 | 2 | null | 50 | 5 | null | From [Wikipedia](http://en.wikipedia.org/wiki/Random_variable):
>
In mathematics (especially probability
theory and statistics), a random
variable (or stochastic variable) is
(in general) a measurable function
that maps a probability space into a
measurable space. Random variables
mapping all possible out... | null | CC BY-SA 2.5 | null | 2010-07-19T19:42:34.670 | 2010-07-19T19:47:54.623 | 2010-07-19T19:47:54.623 | 69 | 69 | null |
58 | 1 | 6988 | null | 14 | 2857 | What is the back-propagation algorithm and how does it work?
| Can someone please explain the back-propagation algorithm? | CC BY-SA 2.5 | null | 2010-07-19T19:42:57.990 | 2013-04-10T12:09:31.350 | 2011-04-29T00:38:41.203 | 3911 | 68 | [
"algorithms",
"optimization",
"neural-networks"
] |
59 | 2 | null | 2 | 29 | null | The assumption of normality is just the supposition that the underlying [random variable](http://en.wikipedia.org/wiki/Random_variable) of interest is distributed [normally](http://en.wikipedia.org/wiki/Normal_distribution), or approximately so. Intuitively, normality may be understood as the result of the sum of a la... | null | CC BY-SA 4.0 | null | 2010-07-19T19:43:20.423 | 2022-11-23T12:58:30.760 | 2022-11-23T12:58:30.760 | 362671 | 39 | null |
60 | 2 | null | 47 | 1 | null | [K-Means clustering](http://en.wikipedia.org/wiki/K-means_algorithm) should work well for this type of problem. However, it does require that you specify the number of clusters in advance.
Given the nature of this data, however, you may be able to work with a [hierarchical clustering algorithm](http://en.wikipedia.org... | null | CC BY-SA 2.5 | null | 2010-07-19T19:43:20.720 | 2010-07-19T19:43:20.720 | null | null | 41 | null |
61 | 2 | null | 26 | 38 | null | Standard deviation is a number that represents the "spread" or "dispersion" of a set of data. There are other measures for spread, such as range and variance.
Here are some example sets of data, and their standard deviations:
```
[1,1,1] standard deviation = 0 (there's no spread)
[-1,1,3] standard deviation... | null | CC BY-SA 3.0 | null | 2010-07-19T19:44:35.037 | 2013-01-23T09:37:19.680 | 2013-01-23T09:37:19.680 | 74 | 74 | null |
62 | 1 | 80 | null | 8 | 267 | With the recent FIFA world cup, I decided to have some fun and determine which months produced world cup football players. Turned out, most footballers in the 2010 world cup were born in the first half of the year.
Someone pointed out, that children born in the first half of the year had a physical advantage over other... | A case of survivorship bias? | CC BY-SA 4.0 | null | 2010-07-19T19:44:58.033 | 2022-02-11T14:03:16.890 | 2022-02-11T14:03:16.890 | 11887 | 58 | [
"bias"
] |
63 | 2 | null | 36 | 43 | null | It might be useful to explain that "causes" is an asymmetric relation (X causes Y is different from Y causes X), whereas "is correlated with" is a symmetric relation.
For instance, homeless population and crime rate might be correlated, in that both tend to be high or low in the same locations. It is equally valid to ... | null | CC BY-SA 2.5 | null | 2010-07-19T19:45:19.780 | 2010-07-19T19:45:19.780 | null | null | 87 | null |
64 | 2 | null | 51 | 8 | null | Yes, there are many methods. You would need to specify which model you're using, because it can vary.
For instance, Some models will be compared based on the [AIC](http://en.wikipedia.org/wiki/Akaike_information_criterion) or [BIC](http://en.wikipedia.org/wiki/Bayesian_information_criterion) criteria. In other case... | null | CC BY-SA 2.5 | null | 2010-07-19T19:46:08.217 | 2010-07-19T20:12:16.453 | 2010-07-19T20:12:16.453 | 5 | 5 | null |
65 | 2 | null | 54 | 20 | null | The first formula is the population standard deviation and the second formula is the the sample standard deviation. The second formula is also related to the unbiased estimator of the variance - see [wikipedia](http://en.wikipedia.org/wiki/Variance#Population_variance_and_sample_variance) for further details.
I suppose... | null | CC BY-SA 2.5 | null | 2010-07-19T19:46:11.383 | 2010-07-19T20:44:53.427 | 2010-07-19T20:44:53.427 | 8 | 8 | null |
66 | 2 | null | 54 | 6 | null | This is [Bessel's Correction](http://en.wikipedia.org/wiki/Bessel%27s_correction). The US version is showing the formula for the sample standard deviation, where the UK version above is the standard deviation of the sample.
| null | CC BY-SA 2.5 | null | 2010-07-19T19:46:11.993 | 2010-07-19T19:46:11.993 | null | null | 41 | null |
67 | 2 | null | 44 | 2 | null | From [Wikipedia](http://en.wikipedia.org/wiki/Data_visualization): Data visualization is the study of the visual representation of data, meaning "information which has been abstracted in some schematic form, including attributes or variables for the units of information"
Data viz is important for visualizing trends in ... | null | CC BY-SA 2.5 | null | 2010-07-19T19:47:16.577 | 2010-07-19T19:47:16.577 | null | null | 36 | null |
69 | 2 | null | 54 | 3 | null | Since N is the number of points in the data set, one could argue that by calculating the mean one has reduced the degree of freedom in the data set by one (since one introduced a dependency into the data set), so one should use N-1 when estimating the standard deviation from a data set for which one had to estimate the... | null | CC BY-SA 2.5 | null | 2010-07-19T19:47:49.587 | 2010-07-19T19:47:49.587 | null | null | 56 | null |
70 | 2 | null | 7 | 19 | null | [World Bank](http://data.worldbank.org/data-catalog) offers quite a lot of interesting data and has been recently very active in developing nice [API](http://data.worldbank.org/developers/api-overview) for it.
Also, [commugrate](http://www.cs.purdue.edu/commugrate/data_access/all_data_sets.php) project has an interesti... | null | CC BY-SA 3.0 | null | 2010-07-19T19:48:45.853 | 2012-04-03T09:51:07.860 | 2012-04-03T09:51:07.860 | 22 | 22 | null |
71 | 2 | null | 58 | 3 | null | It's an algorithm for training feedforward multilayer neural networks (multilayer perceptrons). There are several nice java applets around the web that illustrate what's happening, like this one: [http://neuron.eng.wayne.edu/bpFunctionApprox/bpFunctionApprox.html](http://neuron.eng.wayne.edu/bpFunctionApprox/bpFunction... | null | CC BY-SA 2.5 | null | 2010-07-19T19:50:33.480 | 2010-07-19T19:50:33.480 | null | null | 36 | null |
72 | 2 | null | 35 | 11 | null | for overdispersed poisson, use the negative binomial, which allows you to parameterize the variance as a function of the mean precisely. rnbinom(), etc. in R.
| null | CC BY-SA 2.5 | null | 2010-07-19T19:51:05.117 | 2010-07-19T19:51:05.117 | null | null | 96 | null |
73 | 1 | 104362 | null | 28 | 11307 | Duplicate thread: [I just installed the latest version of R. What packages should I obtain?](https://stats.stackexchange.com/questions/1676/i-just-installed-the-latest-version-of-r-what-packages-should-i-obtain)
What are the [R](http://www.r-project.org/) packages you couldn't imagine your daily work with data?
Please ... | What R packages do you find most useful in your daily work? | CC BY-SA 3.0 | null | 2010-07-19T19:51:32.587 | 2015-08-20T09:00:50.943 | 2017-04-13T12:44:54.643 | -1 | 22 | [
"r"
] |
74 | 2 | null | 6 | 78 | null | In such a discussion, I always recall the famous Ken Thompson quote
>
When in doubt, use brute force.
In this case, machine learning is a salvation when the assumptions are hard to catch; or at least it is much better than guessing them wrong.
| null | CC BY-SA 2.5 | null | 2010-07-19T19:51:34.287 | 2010-07-19T19:51:34.287 | null | null | null | null |
75 | 1 | 94 | null | 5 | 1803 | I'm using [R](http://www.r-project.org/) and the manuals on the R site are really informative. However, I'd like to see some more examples and implementations with R which can help me develop my knowledge faster. Any suggestions?
| Where can I find useful R tutorials with various implementations? | CC BY-SA 2.5 | null | 2010-07-19T19:52:31.180 | 2018-09-26T16:45:54.767 | 2018-09-26T16:45:54.767 | 7290 | 69 | [
"r",
"references"
] |
76 | 2 | null | 73 | 23 | null | I use [plyr](http://cran.r-project.org/web/packages/plyr/index.html) and [ggplot2](http://cran.r-project.org/web/packages/ggplot2/index.html) the most on a daily basis.
I also rely heavily on time series packages; most especially, the [zoo](http://cran.r-project.org/web/packages/zoo/index.html) package.
| null | CC BY-SA 2.5 | null | 2010-07-19T19:52:49.387 | 2010-07-19T19:52:49.387 | null | null | 5 | null |
77 | 2 | null | 36 | 27 | null |
- Sometimes correlation is enough. For example, in car insurance, male drivers are correlated with more accidents, so insurance companies charge them more. There is no way you could actually test this for causation. You cannot change the genders of the drivers experimentally. Google has made hundreds of billions of do... | null | CC BY-SA 2.5 | null | 2010-07-19T19:54:03.253 | 2010-09-09T18:16:59.853 | 2010-09-09T18:16:59.853 | 74 | 74 | null |
78 | 2 | null | 53 | 169 | null | You tend to use the covariance matrix when the variable scales are similar and the correlation matrix when variables are on different scales.
Using the correlation matrix is equivalent to standardizing each of the variables (to mean 0 and standard deviation 1). In general, PCA with and without standardizing will give d... | null | CC BY-SA 4.0 | null | 2010-07-19T19:54:38.710 | 2018-10-10T11:27:18.523 | 2018-10-10T11:27:18.523 | 28666 | 8 | null |
79 | 2 | null | 54 | 5 | null | I am not sure this is purely a US vs. British issue. The rest of this page is excerpted from a faq I wrote.([http://www.graphpad.com/faq/viewfaq.cfm?faq=1383](http://www.graphpad.com/faq/viewfaq.cfm?faq=1383)).
How to compute the SD with n-1 in the denominator
- Compute the square of the difference between each value ... | null | CC BY-SA 4.0 | null | 2010-07-19T19:56:04.120 | 2020-01-13T00:55:13.780 | 2020-01-13T00:55:13.780 | 25 | 25 | null |
80 | 2 | null | 62 | 11 | null | The basic idea behind this is that football clubs have an age cut-off when determining teams. In the league my children participate in the age restrictions states that children born after July 31st are placed on the younger team. This means that two children that are effectively the same age can be playing with two d... | null | CC BY-SA 2.5 | null | 2010-07-19T19:56:43.807 | 2010-07-19T19:56:43.807 | null | null | 93 | null |
81 | 2 | null | 73 | 8 | null | I use the [xtable](http://cran.r-project.org/web/packages/xtable/index.html) package. The xtable package turns tables produced by R (in particular, the tables displaying the anova results) into LaTeX tables, to be included in an article.
| null | CC BY-SA 2.5 | null | 2010-07-19T19:58:56.157 | 2010-07-19T19:58:56.157 | null | null | 69 | null |
83 | 2 | null | 75 | 2 | null | R is designed around ideas such as "reproducible research" and "trustworthy software", as John Chambers says [in his excellent book "Software for Data Analysis: Programming with R"](http://books.google.com/books?id=UXneuOIvhEAC&printsec=frontcover).
One of the best ways to learn R is to look at the wealth of source c... | null | CC BY-SA 2.5 | null | 2010-07-19T20:02:51.297 | 2010-07-19T20:02:51.297 | null | null | 5 | null |
84 | 2 | null | 44 | 6 | null | I would explain it to a layman as:
>
Data visualization is taking data, and making a picture out of it. This allows you to easily see and understand relationships within the data much more easily than just looking at the numbers.
| null | CC BY-SA 2.5 | null | 2010-07-19T20:03:34.307 | 2010-07-19T20:03:34.307 | null | null | 41 | null |
85 | 2 | null | 50 | 48 | null | A random variable is a variable whose value depends on unknown events. We can summarize the unknown events as "state", and then the random variable is a function of the state.
Example:
Suppose we have three dice rolls ($D_{1}$,$D_{2}$,$D_{3}$). Then the state $S=(D_{1},D_{2},D_{3})$.
- One random variable $X$ is ... | null | CC BY-SA 3.0 | null | 2010-07-19T20:08:00.927 | 2016-09-19T08:54:59.927 | 2016-09-19T08:54:59.927 | 35989 | 87 | null |
86 | 2 | null | 50 | 17 | null | Unlike a regular variable, a random variable may not be substituted for a single, unchanging value. Rather statistical properties such as the distribution of the random variable may be stated. The distribution is a function that provides the probability the variable will take on a given value, or fall within a range ... | null | CC BY-SA 2.5 | null | 2010-07-19T20:08:37.010 | 2010-07-20T17:46:55.840 | 2010-07-20T17:46:55.840 | 13 | 13 | null |
89 | 2 | null | 44 | 7 | null | When I teach very basic statistics to Secondary School Students I talk about evolution and how we have evolved to spot patterns in pictures rather than lists of numbers and that data visualisation is one of the techniques we use to take advantage of this fact.
Plus I try to talk about recent news stories where statist... | null | CC BY-SA 2.5 | null | 2010-07-19T20:11:47.797 | 2010-07-19T20:11:47.797 | null | null | 55 | null |
90 | 2 | null | 75 | 4 | null | [R bloggers](http://www.r-bloggers.com/) has been steadily supplying me with a lot of good pragmatic content.
From the author:
```
R-Bloggers.com is a central hub (e.g: A blog aggregator) of content
collected from bloggers who write about R (in English).
The site will help R bloggers and users to connect and follow
... | null | CC BY-SA 2.5 | null | 2010-07-19T20:12:24.130 | 2010-07-19T20:12:24.130 | null | null | 22 | null |
91 | 2 | null | 23 | 26 | null | As user28 said in comments above, the pdf is the first derivative of the cdf for a continuous random variable, and the difference for a discrete random variable.
In the continuous case, wherever the cdf has a discontinuity the pdf has an atom. Dirac delta "functions" can be used to represent these atoms.
| null | CC BY-SA 2.5 | null | 2010-07-19T20:15:54.823 | 2010-07-20T08:52:27.083 | 2010-07-20T08:52:27.083 | 87 | 87 | null |
93 | 1 | null | null | 7 | 481 | We're trying to use a Gaussian process to model h(t) -- the hazard function -- for a very small initial population, and then fit that using the available data. While this gives us nice plots for credible sets for h(t) and so on, it unfortunately is also just pushing the inference problem from h(t) to the covariance fu... | Robust nonparametric estimation of hazard/survival functions based on low count data | CC BY-SA 2.5 | null | 2010-07-19T20:17:07.643 | 2010-09-16T12:33:50.390 | 2010-09-16T12:33:50.390 | null | 61 | [
"nonparametric",
"survival",
"hazard"
] |
94 | 2 | null | 75 | 5 | null | Quick R site is basic, but quite nice for start [http://www.statmethods.net/index.html](http://www.statmethods.net/index.html) .
| null | CC BY-SA 2.5 | null | 2010-07-19T20:18:24.520 | 2010-07-19T20:18:24.520 | null | null | null | null |
95 | 1 | null | null | 7 | 745 | I have been using various GARCH-based models to forecast volatility for various North American equities using historical daily data as inputs.
Asymmetric GARCH models are often cited as a modification of the basic GARCH model to account for the 'leverage effect' i.e. volatility tends to increase more after a negative r... | How Large a Difference Can Be Expected Between Standard GARCH and Asymmetric GARCH Volatility Forecasts? | CC BY-SA 2.5 | null | 2010-07-19T20:21:35.683 | 2012-07-26T19:47:59.577 | 2010-07-20T06:14:40.363 | 154 | 57 | [
"time-series",
"garch",
"volatility-forecasting",
"finance"
] |
96 | 2 | null | 75 | 4 | null | Another great resource is [the LearnR blog](http://learnr.wordpress.com/), which went through an extensive study of visualizations with lattice and ggplot2.
| null | CC BY-SA 2.5 | null | 2010-07-19T20:22:44.807 | 2010-07-19T20:22:44.807 | null | null | 5 | null |
97 | 1 | 104 | null | 69 | 68448 | I have some [ordinal data](http://en.wikipedia.org/wiki/Ordinal_scale#Ordinal_scale) gained from survey questions. In my case they are [Likert style](http://en.wikipedia.org/wiki/Likert_scale) responses (Strongly Disagree-Disagree-Neutral-Agree-Strongly Agree). In my data they are coded as 1-5.
I don't think means w... | What are good basic statistics to use for ordinal data? | CC BY-SA 2.5 | null | 2010-07-19T20:23:22.603 | 2021-04-04T16:52:54.747 | 2021-04-04T16:52:54.747 | 11887 | 114 | [
"descriptive-statistics",
"ordinal-data",
"likert",
"faq"
] |
98 | 2 | null | 1 | 20 | null | Eliciting priors is a tricky business.
[Statistical Methods for Eliciting Probability Distributions](http://www.stat.cmu.edu/tr/tr808/tr808.pdf) and [Eliciting Probability Distributions](http://www.jeremy-oakley.staff.shef.ac.uk/Oakley_elicitation.pdf) are quite good practical guides for prior elicitation. The proces... | null | CC BY-SA 2.5 | null | 2010-07-19T20:23:57.330 | 2010-07-19T20:56:56.330 | 2010-07-19T20:56:56.330 | 39 | 39 | null |
99 | 2 | null | 73 | 8 | null | [multicore](http://cran.r-project.org/web/packages/multicore/index.html) is quite nice for tool for making faster scripts faster.
[cacheSweave](http://cran.r-project.org/web/packages/cacheSweave/index.html) saves a lot of time when using `Sweave`.
| null | CC BY-SA 2.5 | null | 2010-07-19T20:25:08.793 | 2010-07-19T20:25:08.793 | null | null | null | null |
100 | 1 | 110 | null | 7 | 9712 | I'd like to see the answer with qualitative view on the problem, not just definition. Examples and analogous from other areas of applied math also would be good.
I understand, my question is silly, but I can't find good and intuitive introduction textbook on signal processing — if someone would suggest one, I will be h... | What's the purpose of window function in spectral analysis? | CC BY-SA 3.0 | null | 2010-07-19T20:30:23.320 | 2018-02-19T08:31:21.727 | 2018-02-19T08:31:21.727 | 128677 | 117 | [
"signal-processing",
"spectral-analysis"
] |
101 | 2 | null | 31 | 189 | null |
## Understanding $p$-value
Suppose, that you want to test the hypothesis that the average height of male students at your University is $5$ ft $7$ inches. You collect heights of $100$ students selected at random and compute the sample mean (say it turns out to be $5$ ft $9$ inches). Using an appropriate formula/stat... | null | CC BY-SA 3.0 | null | 2010-07-19T20:32:08.183 | 2015-09-14T16:14:44.860 | 2020-06-11T14:32:37.003 | -1 | null | null |
102 | 2 | null | 44 | 2 | null | For me [Illuminating the Path](http://nvac.pnl.gov/agenda.stm) report has been always good point of reference.
For more recent overview you can also have a look at good [article](http://queue.acm.org/detail.cfm?id=1805128) by Heer and colleagues.
But what would explain better than visualization itself?
 | Data Visualization, Infographics, and Statistics
| null | CC BY-SA 3.0 | null | 2010-07-19T20:35:34.510 | 2012-10-24T14:50:25.800 | 2012-10-24T14:50:25.800 | 615 | 46 | null |
107 | 2 | null | 103 | 11 | null | [information aesthetics](https://web.archive.org/web/20120101181841/http://infosthetics.com/) - Data Visualization & Information Design
| null | CC BY-SA 4.0 | null | 2010-07-19T20:36:01.200 | 2022-11-29T16:27:06.847 | 2022-11-29T16:27:06.847 | 362671 | 46 | null |
108 | 2 | null | 103 | 17 | null | [Information Is Beautiful](https://informationisbeautiful.net/) | Ideas, issues, knowledge, data - visualized!
| null | CC BY-SA 4.0 | null | 2010-07-19T20:36:47.800 | 2022-11-29T16:27:52.770 | 2022-11-29T16:27:52.770 | 362671 | 5 | null |
109 | 1 | null | null | 5 | 11443 | Following one-way ANOVA, there are many possible follow-up multiple comparison tests. Holm's test (or better, the Holm-Sidak) test has lots of power, but because it works in a stepwise manner, it cannot compute confidence intervals. Its advantage over the tests than can compute confidence intervals (Tukey, Dunnett) is ... | Power of Holm's multiple comparison testing compared to others | CC BY-SA 2.5 | null | 2010-07-19T20:37:21.667 | 2010-08-04T14:38:22.450 | null | null | 25 | [
"multiple-comparisons",
"statistical-power"
] |
110 | 2 | null | 100 | 5 | null | It depends on where you apply the window function. If you do it in the time domain, it's because you only want to analyze the periodic behavior of the function in a short duration. You do this when you don't believe that your data is from a stationary process.
If you do it in the frequency domain, then you do it to... | null | CC BY-SA 2.5 | null | 2010-07-19T20:40:36.573 | 2010-07-19T20:40:36.573 | null | null | 61 | null |
111 | 2 | null | 40 | 11 | null | In R, the default setting for random number generation are:
- For U(0,1), use the Mersenne-Twister algorithm
- For Guassian numbers use the numerical inversion of the standard normal distribution function.
You can easily check this, viz.
```
> RNGkind()
[1] "Mersenne-Twister" "Inversion"
```
It is possible to ch... | null | CC BY-SA 2.5 | null | 2010-07-19T20:41:24.917 | 2010-07-19T20:41:24.917 | null | null | 8 | null |
112 | 2 | null | 103 | 2 | null | I see all my favorite blogs have been listed. So I'll give you this one:
[I Love Charts](http://ilovecharts.tumblr.com/)
It's a bit light hearted.
| null | CC BY-SA 3.0 | null | 2010-07-19T20:52:27.263 | 2012-10-24T14:59:02.753 | 2012-10-24T14:59:02.753 | 615 | 12 | null |
YAML Metadata Warning:The task_categories "text2text-generation" is not in the official list: text-classification, token-classification, table-question-answering, question-answering, zero-shot-classification, translation, summarization, feature-extraction, text-generation, fill-mask, sentence-similarity, text-to-speech, text-to-audio, automatic-speech-recognition, audio-to-audio, audio-classification, audio-text-to-text, voice-activity-detection, depth-estimation, image-classification, object-detection, image-segmentation, text-to-image, image-to-text, image-to-image, image-to-video, unconditional-image-generation, video-classification, reinforcement-learning, robotics, tabular-classification, tabular-regression, tabular-to-text, table-to-text, multiple-choice, text-ranking, text-retrieval, time-series-forecasting, text-to-video, image-text-to-text, image-text-to-image, image-text-to-video, visual-question-answering, document-question-answering, zero-shot-image-classification, graph-ml, mask-generation, zero-shot-object-detection, text-to-3d, image-to-3d, image-feature-extraction, video-text-to-text, keypoint-detection, visual-document-retrieval, any-to-any, video-to-video, other
Cross Validated / stats.stackexchange.com
Dataset Summary
This dataset contains all posts submitted to stats.stackexchange.com before the 30th of August 2023 formatted as Markdown text.
The data is sourced from Internet Archive StackExchange Data Dump and follows the format by mikex86/stackoverflow-posts
Dataset Structure
Each record corresponds to one post of a particular type.
Original ordering from the data dump is not exactly preserved due to parallelism in the script used to process the data dump.
The markdown content of each post is contained in the Body field. The license for a particular post is contained in the ContentLicense field.
Data Fields
{
  Id: long,
  PostTypeId: long, // 1=Question, 2=Answer, 3=Orphaned tag wiki, 4=Tag wiki excerpt, 5=Tag wiki, 6=Moderator nomination, 7=Wiki Placeholder, 8=Privilige Wiki
  AcceptedAnswerId: long | null, // only present if PostTypeId=1
  ParentId: long | null, // only present if PostTypeId=2
  Score: long,
  ViewCount: long | null,
  Body: string | null,
  Title: string | null,
  ContentLicense: string | null,
  FavoriteCount: long | null,
  CreationDate: string | null,
  LastActivityDate: string | null,
  LastEditDate: string | null,
  LastEditorUserId: long | null,
  OwnerUserId: long | null,
  Tags: array<string> | null
}
Also consider the StackExchange Datadump Schema Documentation, as all fields have analogs in the original dump format.
How to use?
from datasets import load_dataset

# predownload full dataset
ds = load_dataset('theblackcat102/crossvalidated-posts', split='train')

# dataset streaming (will only download the data as needed)
ds = load_dataset('theblackcat102/crossvalidated-posts', split='train', streaming=True)

for sample in iter(ds): print(sample["Body"])
How is the text stored?
The original Data Dump formats the "Body" field as HTML, using tags such as <code>, <h1>, <ul>, etc.
This HTML format has been converted to Markdown following mikex86/stackoverflow-posts conversion rule.
Example:
After differencing I saw that my constant/intercept is not statistically significant. Does anybody know how to fit the same model without the const term?
im using statsmodels.tsa.arima.model
To give a relative example I have: ARIMA(data, order=(3,0,0)) an AR(3) model and say it that the second coefficient is insignificant. I can get rid of it by typing
ARMA(data,order=([1, 3], 0, 0)
but how can I get rid of coefficient??
- Downloads last month
- 37